Using RStudio this tutorial will cover:
- Many to one merge
- Generate a Map showing the spatial distribution of poverty in the US
- t-test comparing poverty rates between low and high minimum wage areas
- Confidence Interval plots and bar plots to visualize t-tests
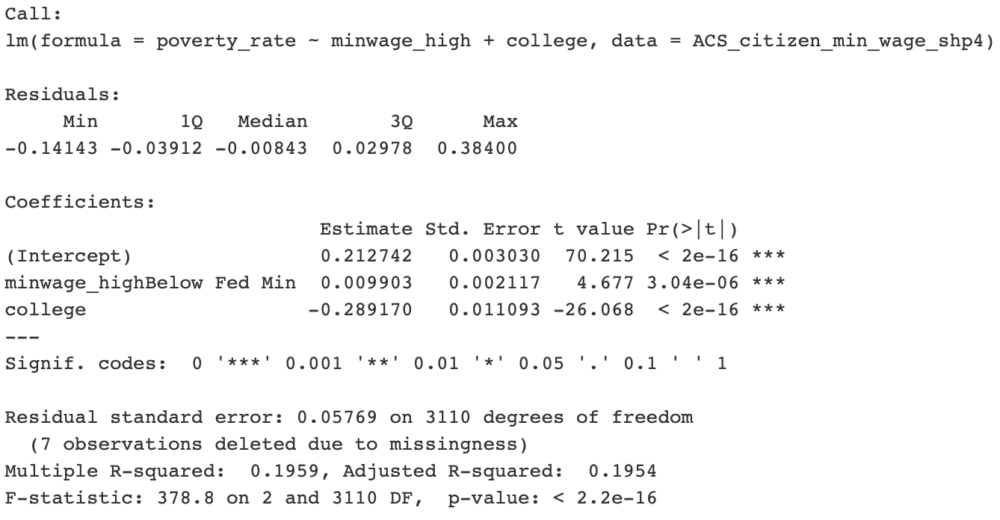
- Linear Regression