Using RStudio, this tutorial will cover the following:
- Will look at data from the American Community Survey (ACS)
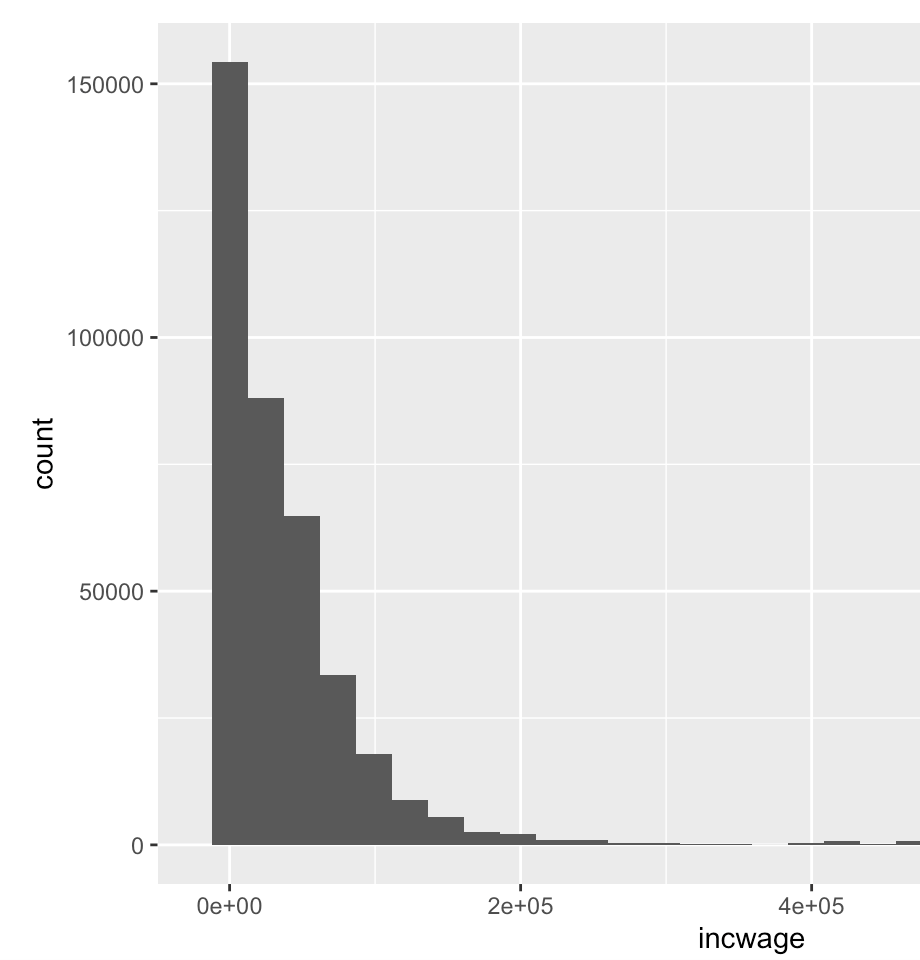
- Generate simple numerical and graphical summaries of ACS data
- Will explore the relationship between race, education, and income
- Visualize data using the tidyverse suite of packages
